

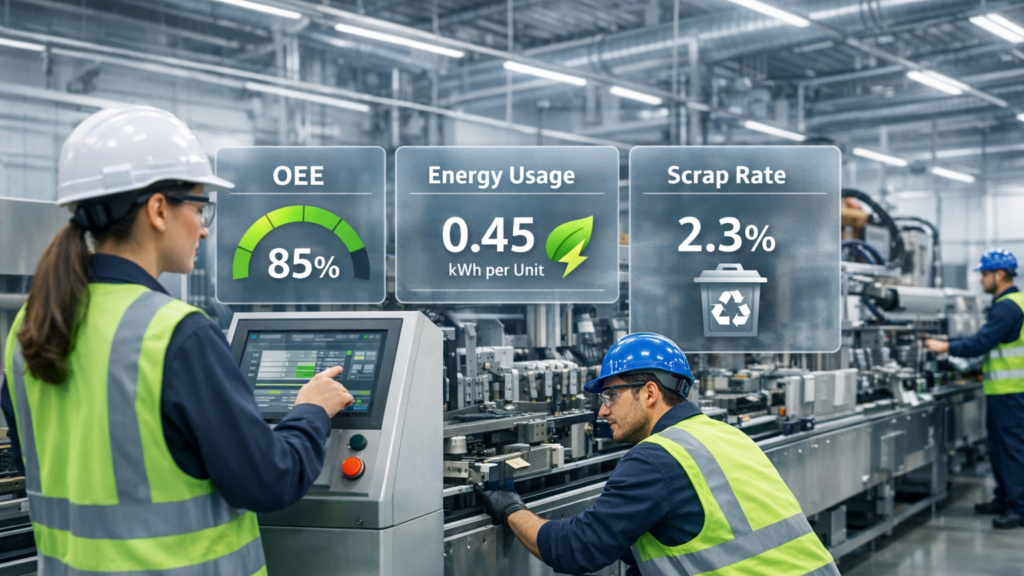

Overall Equipment Effectiveness (OEE) remains a powerful single‑number view of manufacturing performance. But as energy costs rise and circularity pressure grows, OEE by itself misses important drivers of cost, risk and regulatory compliance. Sustainability‑driven OEE (S‑OEE) extends the OEE framework with energy and waste metrics so production teams can optimize both throughput and environmental performance.
Why traditional OEE is no longer enough
Traditional OEE looks at availability, performance and quality to quantify asset productivity. That works well to surface lost production time and quality defects. However, it ignores how much energy each product consumes and how much waste (scrap, rework, packaging loss) the process produces. For manufacturers that face volatile energy prices, carbon reporting obligations, or ambitious sustainability targets, not including those dimensions leaves costly blind spots.
What is Sustainability‑driven OEE (S‑OEE)?
S‑OEE retains the standard OEE pillars but augments them with two sustainability dimensions: energy intensity and waste intensity. The goal is not to replace OEE but to provide a composite view that balances throughput with environmental and cost exposure. S‑OEE helps answer questions such as: Which shift runs the most efficiently per kWh? Which product variant generates the most scrap per unit? Where are energy and waste inefficiencies eroding margin?
Key energy and waste metrics to add
- Energy per good unit (kWh/unit): Total energy consumed divided by number of good units produced in the same period.
- Energy per operational hour (kWh/hour): Useful for comparing different asset types or line configurations.
- Carbon intensity (kg CO2e/unit): If emission factors are available, translate energy use into carbon to support reporting.
- Waste rate (% of input): Percentage of raw material that becomes scrap or off-spec product.
- Scrap per unit (kg/unit): Mass of scrap normalized by produced units to find high‑waste SKUs or processes.
- Rework time (minutes/unit): Labour and machine time spent on rework, which also consumes energy.
How to measure and implement S‑OEE in practice
Start with the simplest, highest‑impact measures and iterate:

- Map data sources: Identify energy meters, PLC counters, MES outputs and quality/rework logs. Even basic submetering on critical lines can unlock value.
- Establish common time windows: Align energy and production timestamps (shift, hour, batch) so metrics are comparable.
- Define calculation rules: Document how you compute kWh/unit, waste rate and any normalizations (e.g., temperature, product mix).
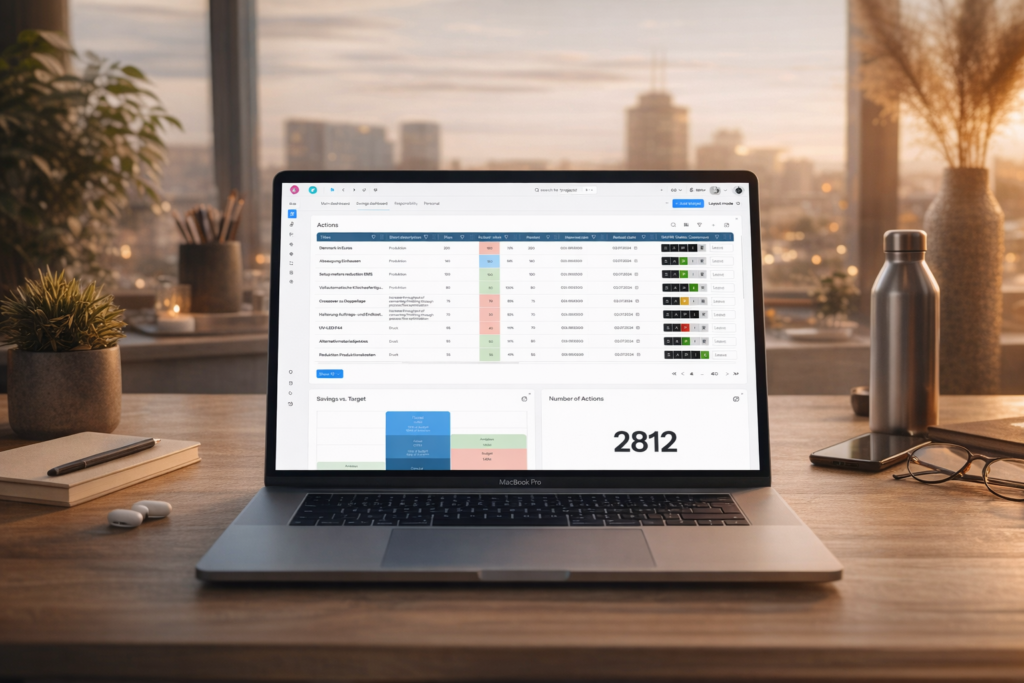
- Integrate into dashboards: Present energy and waste KPIs alongside OEE so teams see trade‑offs in one view.
- Pilot and scale: Pilot on one line or SKU, validate data quality, then roll out across plants.
Data collection, analysis and tooling considerations
Data availability determines how advanced your S‑OEE can be. Consider these practical points:
- Metering granularity: Whole‑site meters give a high‑level view; line or machine submeters enable unit‑level metrics.
- Data synchronization: Use consistent clocks and timestamps to avoid misleading ratios.
- Normalization: Normalize for production mix or environmental factors when comparing lines or shifts.
- Tooling: Modern MES, industrial analytics or IoT platforms can compute S‑OEE automatically; Excel works for pilots.
Use cases by segment
Mid‑market / Small plants: Focus on a single high‑cost line. Submetering and a simple dashboard can reveal quick wins like reducing idling or optimizing start/stop sequences.
Industrial / Producing industry: Combine machine data with material yields to reduce scrap and capture energy savings through schedule optimization.
Enterprise: Standardize S‑OEE calculations across sites to enable benchmarking, capital allocation and corporate reporting.
Automotive: Track energy and scrap per vehicle or subassembly to inform component sourcing, takt planning and sustainability disclosure.
Change management and KPIs to track success
Introduce S‑OEE incrementally. Suggested KPIs to monitor progress:
- Delta in kWh/unit and kg CO2e/unit after process changes
- Reduction in scrap rate (%) and rework time
- Improvement in combined S‑OEE score (OEE adjusted for energy & waste)
- Cost savings from energy and material reductions
Engage operators with actionable targets (e.g., reduce idling by X minutes/shift) and make metrics visible on the shop floor.
Common pitfalls and how to avoid them
- Pitfall: Mixing incomparable periods. Fix: Always align energy and production windows.
- Pitfall: Overly complex indices early on. Fix: Start with two or three clear metrics and expand.
- Pitfall: Siloed data ownership. Fix: Create a cross‑functional team (operations, maintenance, energy manager, sustainability).
Next steps and recommended actions
- Run a quick data discovery to map where energy and waste data exist.
- Pilot S‑OEE on one high‑impact line with weekly reviews and operator involvement.
- Standardize calculation rules and dashboard layouts before scaling.
- Link improvements to financial and sustainability targets to secure executive support.
By extending OEE with energy and waste metrics, manufacturers capture hidden costs and unlock improvements that improve margin and sustainability at once. S‑OEE turns environmental performance from a reporting chore into a source of competitive advantage.
FAQ
How is energy per unit measured and normalized?
Energy per unit is total energy consumed during the measurement window divided by the number of good units produced in the same window. Normalize by production mix or environmental conditions when comparing different lines or time periods to ensure fair comparisons.
Do I need submeters on every machine to implement S‑OEE?
No. Start with submeters on critical lines or machines with the highest energy use. Whole‑site meters can support higher‑level analysis while targeted submetering enables unit‑level S‑OEE accuracy.
How do I combine OEE with energy and waste into a single score?
There is no single industry standard. A pragmatic approach is to keep OEE separate but create a composite dashboard that shows OEE alongside kWh/unit and scrap rate. If a combined index is needed, apply weighted factors aligned with business priorities (e.g., cost or carbon impact) and validate the weighting with stakeholders.
Which teams should own S‑OEE implementation?
Cross‑functional ownership works best: operations for process changes, maintenance for equipment issues, sustainability/energy managers for metrics and reporting, and IT for data integration.
Ready to pilot Sustainability‑driven OEE? Start with a 4‑week data discovery on your highest‑cost line, align energy and production timestamps, and present S‑OEE insights in your weekly performance meeting. Contact your internal operations or sustainability lead to begin.