

Operational Excellence (OE) software is already central to process control, quality and productivity. Extending it to capture and report sustainability KPIs — including Scope 1, 2 and 3 — turns operational data into reliable environmental performance metrics. This article explains which KPIs matter, how to map sources and build reporting flows that work for Mittelstand, industrial manufacturing and automotive organizations.
Why integrate sustainability KPIs into OE software?
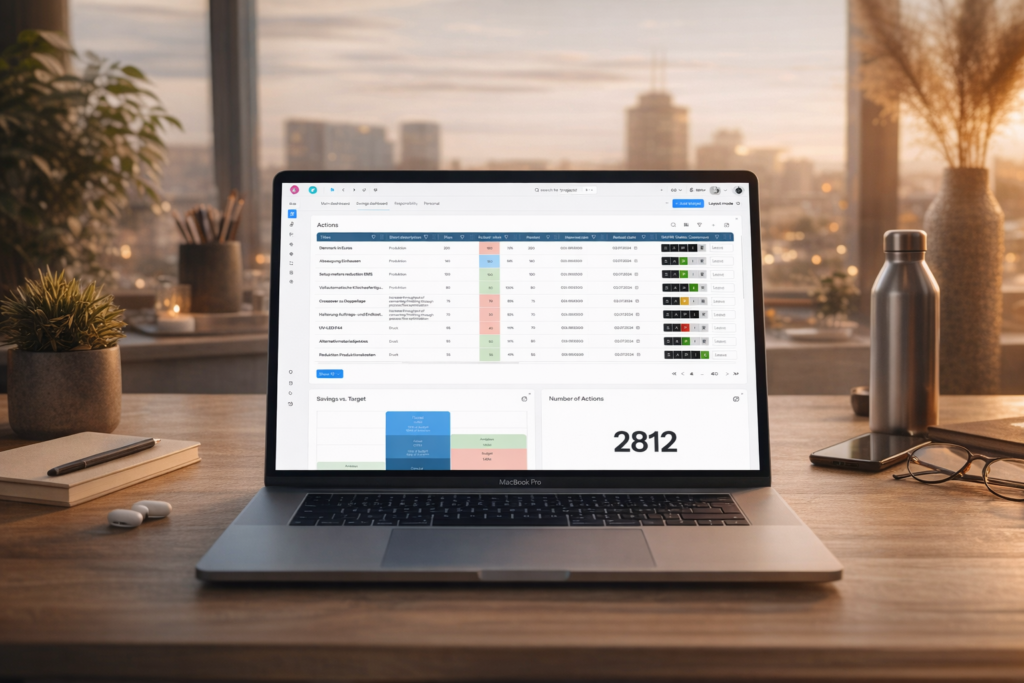
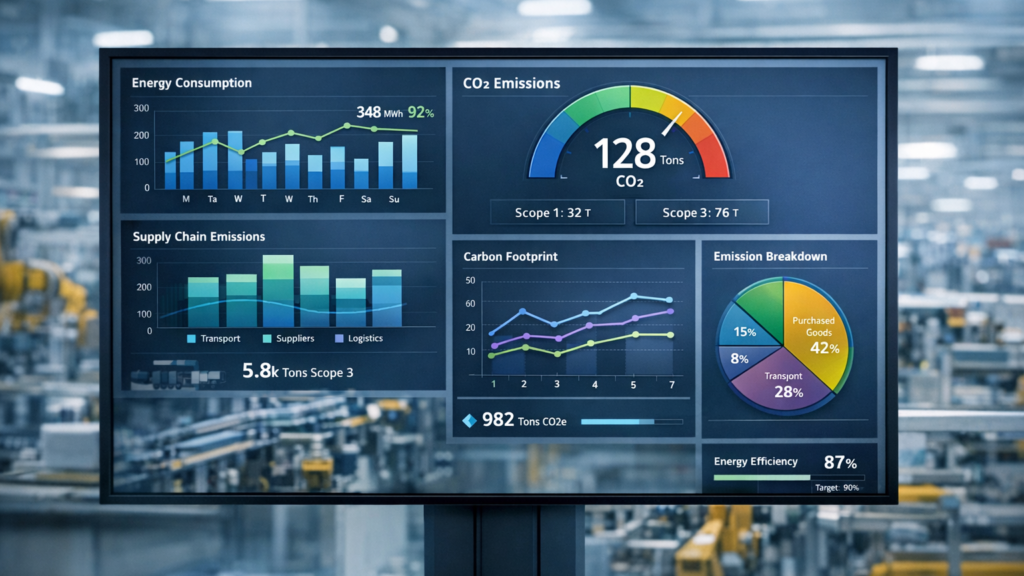
Embedding sustainability metrics where operations run avoids duplicate data entry, reduces latency, and creates a single source of truth. OE systems capture production volumes, energy use, material flows and maintenance events — all inputs for greenhouse gas (GHG) reporting and resource-efficiency KPIs. When KPIs live in OE software you enable automated dashboards, alerting for deviations, and traceable audit trails.
Understand Scope 1, 2 and 3 for practical reporting
- Scope 1: Direct emissions from onsite fuel combustion, process emissions, company-owned vehicles. Measurable from meters, fuel logs and equipment sensors.
- Scope 2: Indirect emissions from purchased electricity, steam or heat. Calculated by multiplying energy consumption by supplier-specific or location-based emission factors.
- Scope 3: Indirect upstream and downstream emissions (purchased goods, transport, use of sold products, end-of-life). Requires collaboration with suppliers and logistics partners and use of spend-based or activity-based models.
Which sustainability KPIs matter by sector
Choose KPIs that align with business priorities and data availability. Examples:
- Manufacturing & producing industry: Energy intensity (kWh/unit), CO2e per tonne produced, waste rate (kg/tonne), water use per unit.
- Automotive: CO2e per vehicle, supplier emissions share (Scope 3 upstream), material circularity percentage, battery lifecycle emissions (if applicable).
- Enterprise & mid-market: Total emissions (Scope 1–3) by category, emissions per revenue (tCO2e/€), percentage of renewable electricity consumption.
Mapping data sources and measurement frequency
Start by inventorying available operational data:
- Real-time: energy meters, flow meters, machine sensors, PLC outputs.
- Batch/periodic: production orders, shift logs, maintenance records.
- Third-party: supplier-delivered emissions data, utility invoices, transport manifests.
Define frequency per KPI. Energy intensity may be updated hourly; supplier Scope 3 figures often monthly or quarterly. OE software should support mixed-frequency inputs and rollups.
Designing KPI models inside OE software
Model KPIs with clear formulas, units and emission factors. Key design steps:
- Create canonical data mappings (e.g., meter ID → site → process line).
- Store and version emission factors used for calculations.
- Support both activity‑based (kg material × emission factor) and spend‑based approaches for Scope 3.
- Implement rollups: machine → line → site → corporate.
Data governance, validation and audit trails
Governance is essential for credible reporting. Implement:
- Roles and approvals for data inputs and model changes.
- Validation rules and exception alerts (missing meter readings, abnormal values).
- Audit logs that record who changed factors, formulas or source mappings.
Operational workflows: from shop floor to corporate reports
Create end-to-end workflows so operational teams feed accurate data and sustainability teams produce certified reports:
- Automated data ingestion from meters and ERP.
- Predefined ETL rules to normalize units and timestamps.
- Dashboards for operations showing KPI trends and actionable alerts (e.g., energy spike by shift).
- Scheduled export to corporate reporting tools and external disclosures (CDP, sustainability reports).
Common implementation challenges and mitigation
- Data gaps for Scope 3: mitigate by prioritizing high-impact categories and engaging suppliers with templated data requests.
- Inconsistent units and timestamps: enforce canonical schemata in the OE system.
- Resistance to change: start with pilot lines and measurable quick wins to prove value.
- Complexity of emission factors: store versioned factors and document sources.
Quick checklist to get started
- Map top GHG sources across Scope 1–3 and prioritize categories by impact and feasibility.
- Inventory data sources and connect high-value meters and systems to OE software first.
- Define KPI formulas, units, update frequency and dashboard requirements.
- Set governance: data owners, validation rules and audit logging.
- Run a pilot, review results, then scale to other lines/sites.
For organizations comparing digital tools for Kaizen events, Excel and OE integrations, consider practical differences and productivity impacts when choosing a platform. See a focused comparison of digital tools at this resource: BeLean digital tools comparison.
Resources and next steps
Start with a prioritized Scope 1–3 inventory and a small pilot in one plant line. Measure quick wins (energy per unit, waste reduction) to build momentum and secure cross‑functional buy‑in. Over time, expand supplier engagement to improve Scope 3 fidelity and automate reporting for regulatory and investor needs.
Weiterfuehrende Inhalte
FAQ
Which Scope categories should mid-market manufacturers prioritize first?
Start with Scope 1 and 2 (onsite fuel and purchased energy) because data is typically available in operations. Then address high-impact Scope 3 categories such as purchased goods, upstream transport and product use, prioritizing suppliers and categories that represent the most emissions.
How accurate do emission factors need to be for KPI reporting?
Accuracy should match the report’s purpose. Operational dashboards can use location‑based or industry averages for near‑real‑time monitoring. For external disclosures or compliance, use supplier-specific or verified factors and keep versioned records to support audits.
Can OE software handle mixed-frequency data (real-time meters and quarterly supplier data)?
Yes. A robust OE system ingests multiple frequencies, normalizes timestamps and aggregates data to the required reporting cadence. Define clear rollup rules so hourly meter data and monthly supplier inputs produce consistent KPIs.
CTA rules: Offer a short pilot for one plant line; provide measurable objectives and timeline; present results in 4–8 weeks. Contact your OE software provider or project lead to scope a pilot today.
